Portfolio
Mastery AnalyticsA command dashboard with AI-assisted triage

Pinch to zoom into any board for detail.
UI/UX CASE STUDY · WEB APP

Mastery
Analytics

A deal intelligence dashboard for deciding which project leads to chase, and acting on them in one screen.

Web app Dashboard B2B SaaS AI-assisted Figma
Designed by Krithik Ram R K
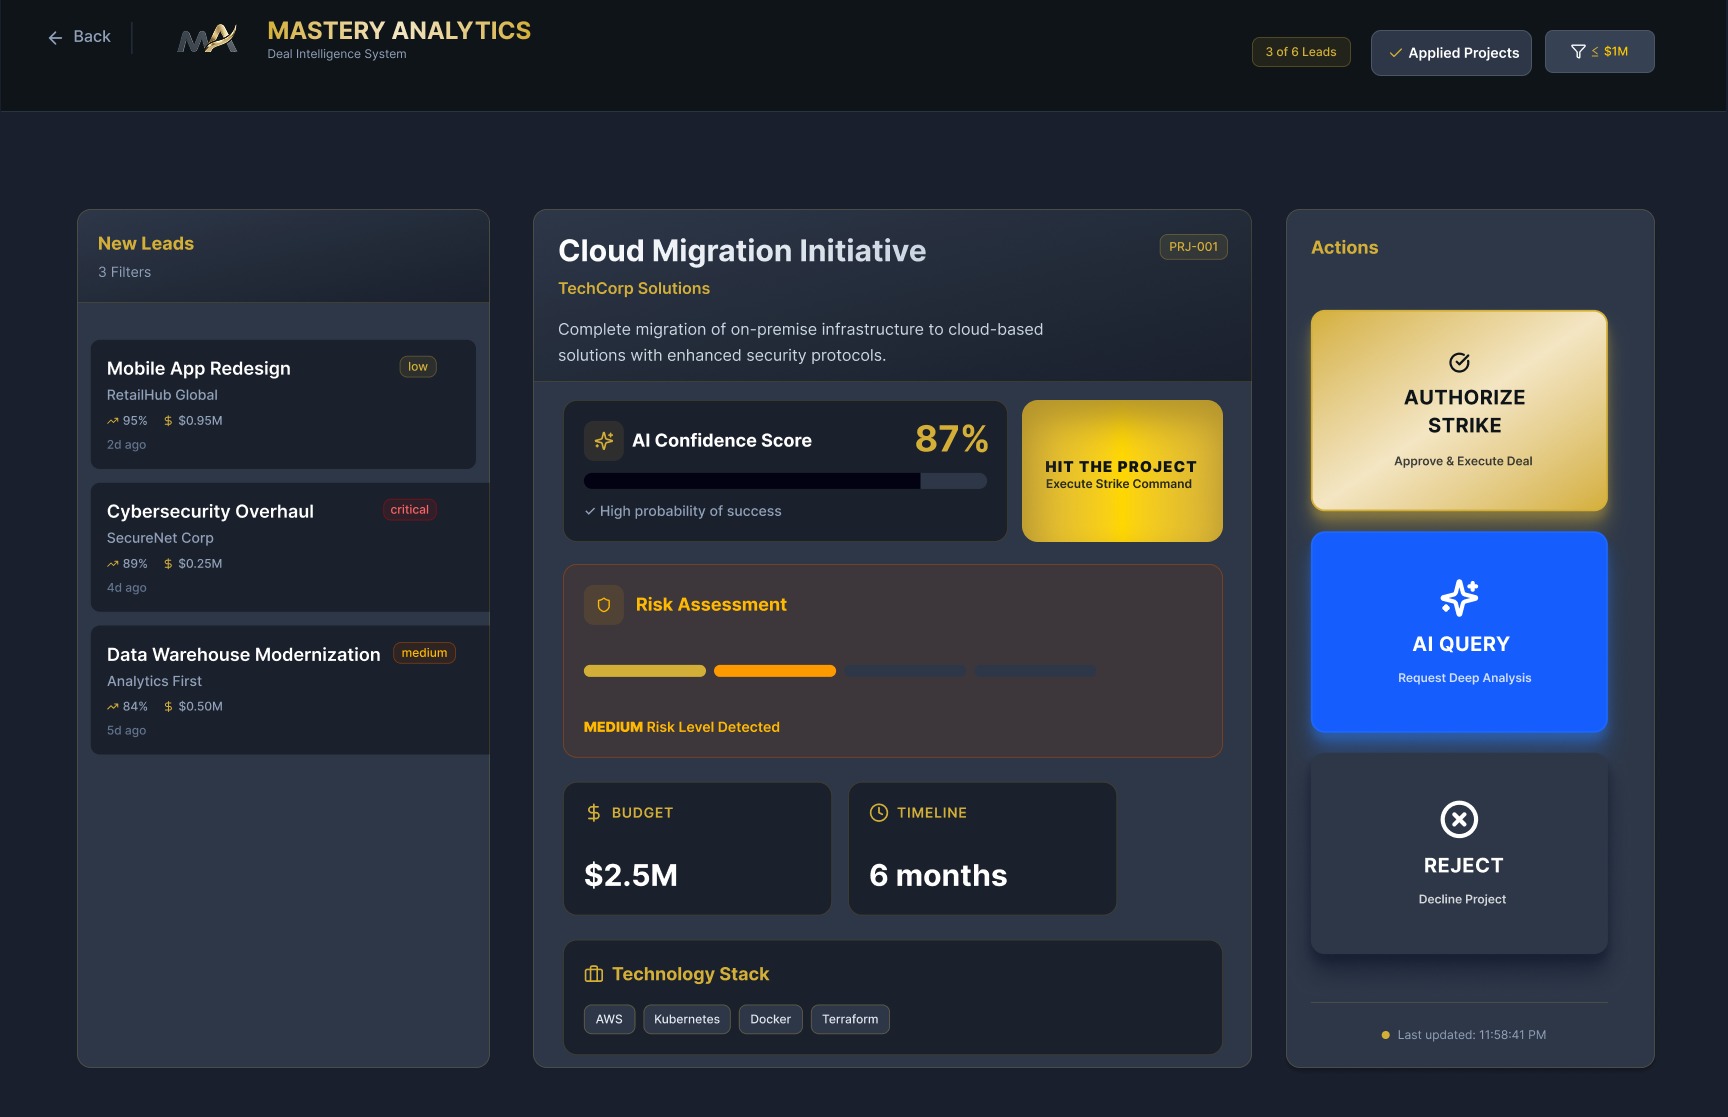
Triage dashboard with a list of new leads, the selected lead’s AI confidence and risk, and Authorize, AI Query and Reject actions
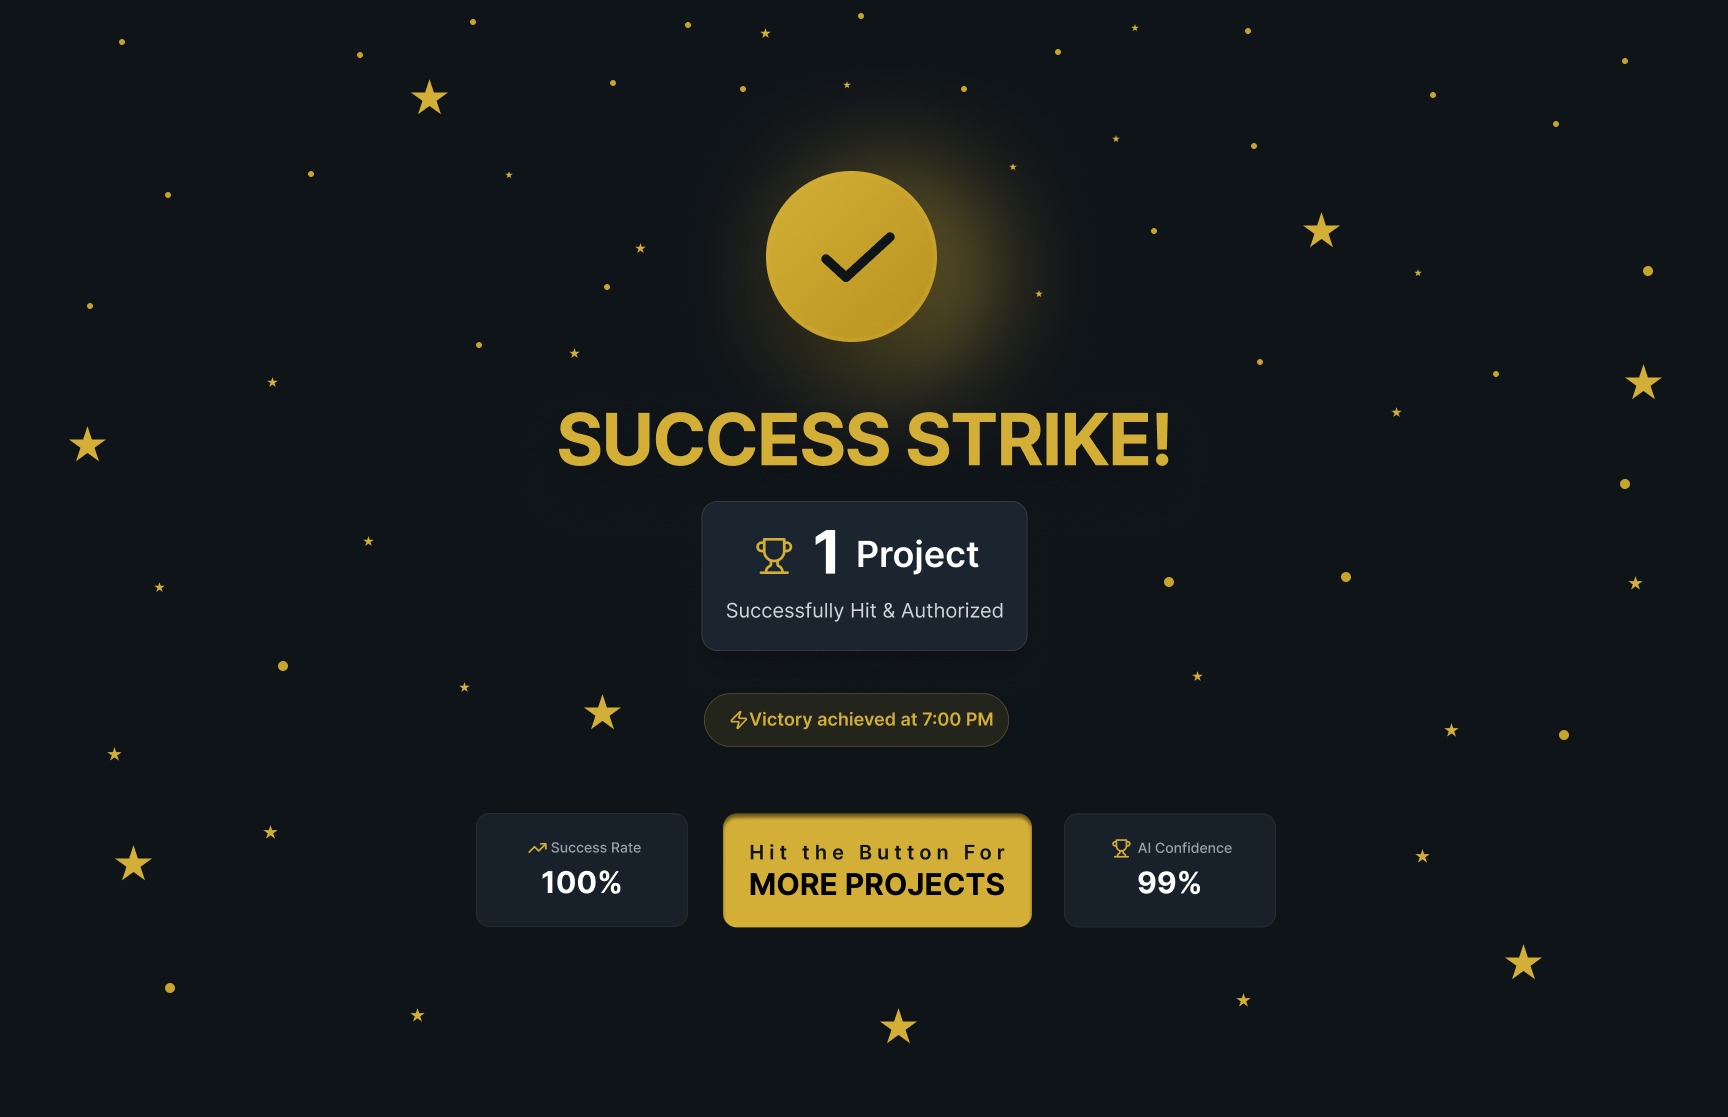
Success Strike celebration screen with a gold check mark and stars
01 — OVERVIEW

Every project lead is a bet. Mastery Analytics shows the odds before you place it.

Mastery Analytics is a deal intelligence dashboard for teams that bid on client projects. New leads land in one triage screen, each with an AI confidence score and a risk level, and you can authorize, analyse or reject them on the spot.

I designed the web app end to end: a portfolio overview, the triage dashboard with its hover and filter states, a success moment and an applied-projects tracker.

ROLE UI/UX Designer
PLATFORM Desktop web · 1728 × 1117
TOOLS Figma
TIMELINE [Add timeline]
DELIVERABLES 37 frames incl. all states
Portfolio at a glance

Projects, success rate, revenue, pending reviews and response time on one home screen.

Triage in one screen

Lead list, lead detail and actions side by side, with a budget filter on top.

AI score and risk

A confidence score and a four-step risk meter for every lead, plus AI Query for more.

Track what you win

A celebratory confirmation, then every authorized project in one list.

02 — THE PROBLEM

Good leads go cold while teams dig through tools to decide whether to chase them.

70%

of sales reps’ time goes to non-selling tasks such as admin and meeting prep, according to Salesforce’s State of Sales research.

7×

as likely to qualify a lead when a firm follows up within an hour rather than later, in a Harvard Business Review study of online leads.

60%

of B2B seller work will run through generative-AI conversational interfaces by 2028, up from under 5% in 2023, Gartner predicts.

Deciding whether to chase a $2.5M cloud migration can mean hopping between email, spreadsheets and the CRM, then waiting on a colleague for a risk read.

By the time there’s an answer, the client may have moved on.

HOW MIGHT WE

Let a pre-sales lead judge, decide on and track a project lead from one screen, with AI doing the first read?

Sources: Salesforce, State of Sales (6th edition, 2024); Oldroyd, McElheran and Elkington, “The Short Life of Online Sales Leads”, Harvard Business Review (2011); Gartner press release, 21 September 2023.

03 — USER PERSONA

Meet Meera: she decides which projects her team chases.

Proto-persona · validate with interviews
MK
Meera Krishnan
The deal gatekeeper
AGE36
BASED INBengaluru
ROLEPre-sales Director, IT services
REVIEWSAbout 25 leads a week
WORKS ON16-inch laptop

“Show me what’s worth chasing and why, then let me act on it right there.”

Meera runs pre-sales for a 300-person IT services company. New project requests arrive every week from client portals, email and referrals. She has to decide quickly which to bid on without overloading her delivery teams, and report the pipeline to leadership every Monday.

GOALS
Decide on a lead in minutes, not days
See value, risk, timeline and tech stack side by side
Get a deeper analysis when she’s unsure
Know the total value her team has committed to
FRUSTRATIONS
Lead details scattered across email, sheets and the CRM
Gut-feel calls with no shared way to score a lead
Good leads going cold while she waits on a risk read
Dashboards full of charts but no clear next step
HABITS
Starts every day with a pipeline check
Filters by budget before reading any detail
Escalates anything above $3M to leadership
PERSONALITY
Comfort with dataHigh
Appetite for riskMedium–low
Time pressureHigh
04 — USER JOURNEY

Meera’s morning, from first coffee to Monday report.

01Check in
02Scan
03Evaluate
04Decide
05Track
DOING
Opens the home dashboard with her first coffee.
Filters leads by budget and scans the list.
Reads confidence, risk, budget, timeline and stack.
Authorizes, asks AI for more, or rejects.
Checks Applied Projects before her Monday report.
THINKING
“How’s the pipeline looking?”
“Which of these are worth my time?”
“Can my team actually deliver this?”
“Am I sure enough to commit?”
“What have we signed up for?”
FEELING
Calm
Overloaded
Focused
Uneasy
Satisfied
PAIN POINT
Pipeline numbers live in different tools.
Too many leads and no way to rank them.
A risk read means chasing a colleague.
A wrong call can tie a team up for months.
No single list of what she has committed to.
HOW IT HELPS
Nine portfolio numbers on one home screen.
Lead cards with score, budget and risk badge, plus a budget filter.
AI confidence score and a four-step risk meter.
Authorize, AI Query and Reject side by side.
A success screen and the Applied Projects list.
05 — USER FLOW
From a morning check-in to a signed-off project.
One main path, a budget filter on the side, and three ways to act on a lead.
Home dashboard
Triage dashboard
Select a lead
Review score, risk, budget
Choose an action
Filter by budget
Reject
decline the project
AI Query
request deep analysis
Authorize strike
approve and execute
Success Strike!
Back to triage for more
Applied Projects
open
apply
Dashed boxes are side paths. Applied Projects is also one click away in the header of every screen.
06 — VISUAL LANGUAGE

Gold marks value and action. Everything else steps back.

BRAND
Mastery Analytics logo: an MA monogram with a gold swoosh beside the gold wordmark and the tagline Deal Intelligence System

A gold-on-midnight command centre. The monogram’s swoosh and the gold wordmark set the tone; gold then only appears where there’s money or a decision.

COLOUR
Midnight
#0F1419
Header, celebration
Navy
#1A1F2E
Page background
Slate
#2D3748
Panels, Reject
Gold
#D4AF37
Brand, value, Authorize
Strike Yellow
#FED603
Hit the Project glow
AI Blue
#155DFC
AI Query
Amber
#FE9A00
Medium risk
Ember
#BB4D00
High risk
TYPE
Aa
Neo-grotesque sans
Bold numbers, quiet labels
$178.5M48–72 · Bold KPI
Lead title30 · SemiBold
WORDMARK24 · Bold caps
Card title18 · Medium
Body and descriptions16 · Regular
SECTION LABEL12 · SemiBold caps
Sizes in px, measured from the 1728 × 1117 frames.
COMPONENTS
Header buttons
6 New Leads
Risk badges
low medium high critical
KPI tile
SUCCESS RATE
87.5%
Deal closure efficiency
Tech stack chips and live status
AWS Kubernetes Docker Terraform
Live
07 — HOME DASHBOARD

A bento overview that answers “how are we doing?” in five seconds.
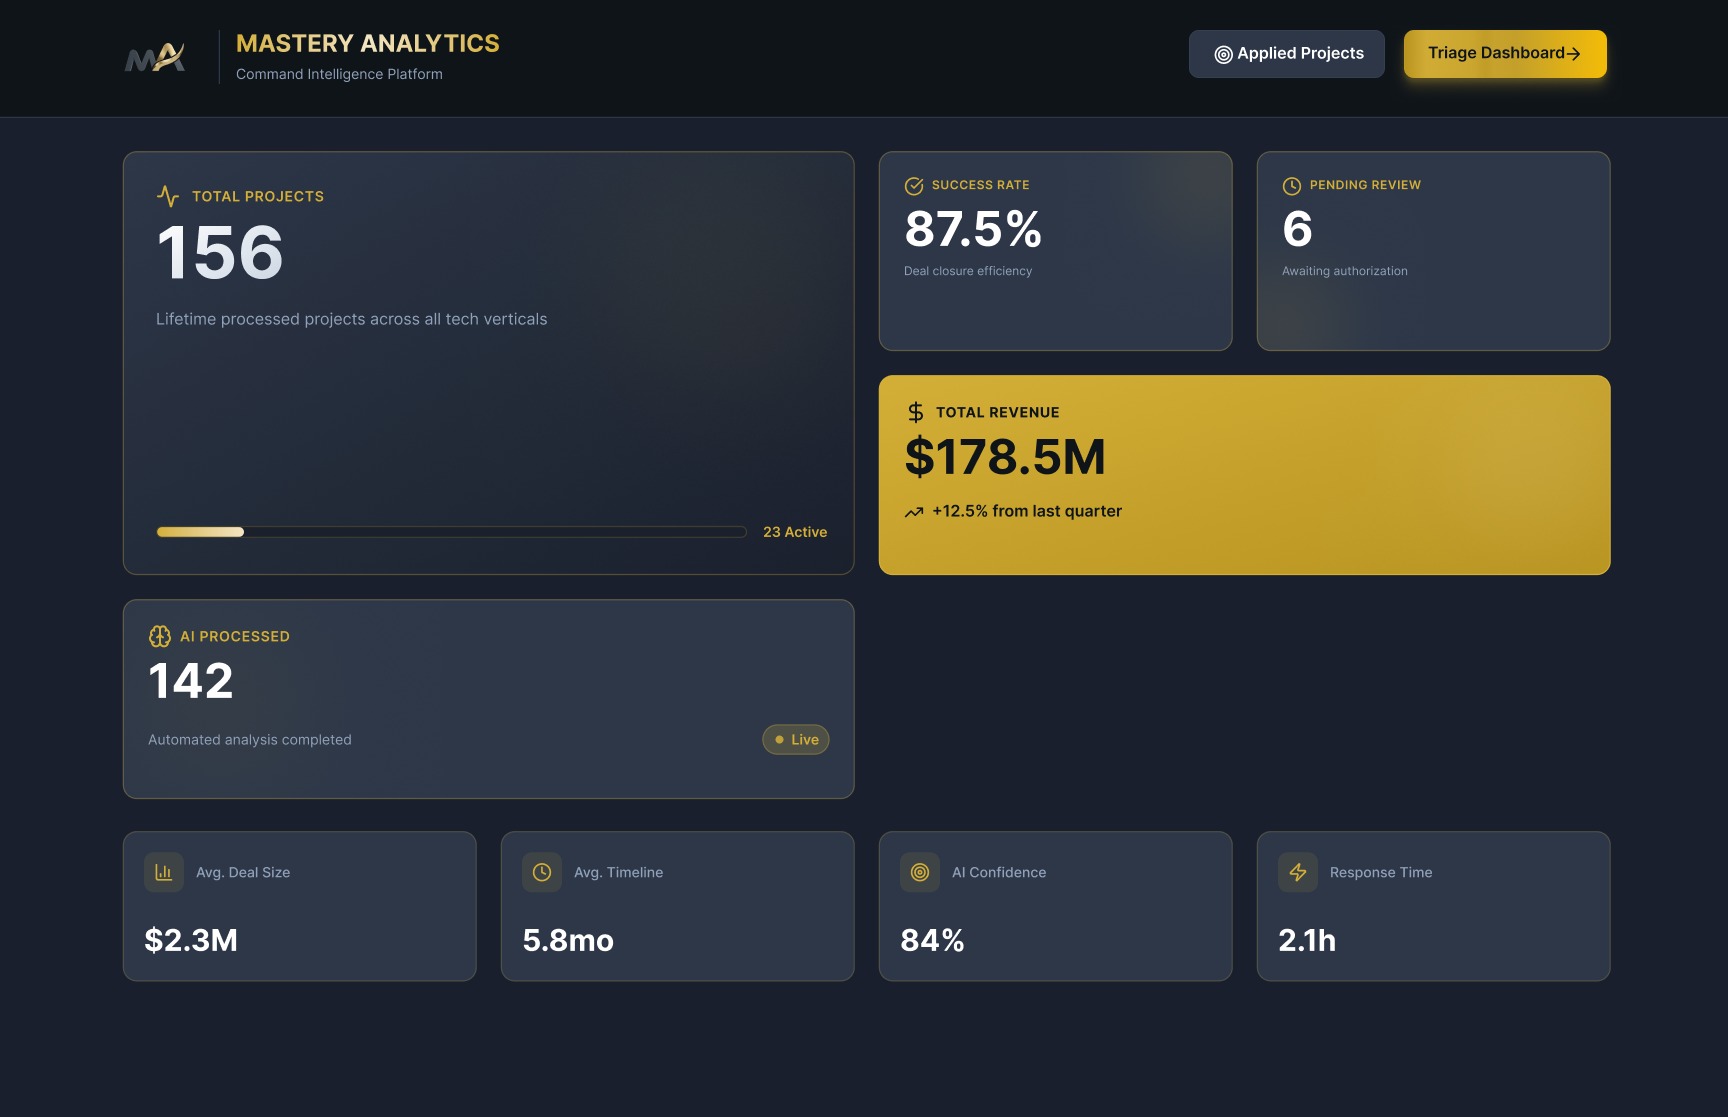
Home dashboard with KPI tiles: total projects 156, success rate 87.5%, pending review 6, total revenue $178.5M, AI processed 142, and four smaller metrics
1
2
3
4
5
6
1The biggest tile tells the long story: 156 projects to date, with a bar for the 23 still active.
2Revenue gets the only gold tile: it’s the number leadership asks about first.
3Pending review is the bridge to action: six leads waiting in triage.
4A Live pill shows that AI analysis keeps running in the background.
5Four smaller tiles answer the follow-ups: deal size, timeline, AI confidence and response time.
6One gold button goes straight to the Triage Dashboard, with Applied Projects beside it.
08 — TRIAGE DASHBOARD

List, detail and decision, left to right, on one screen.

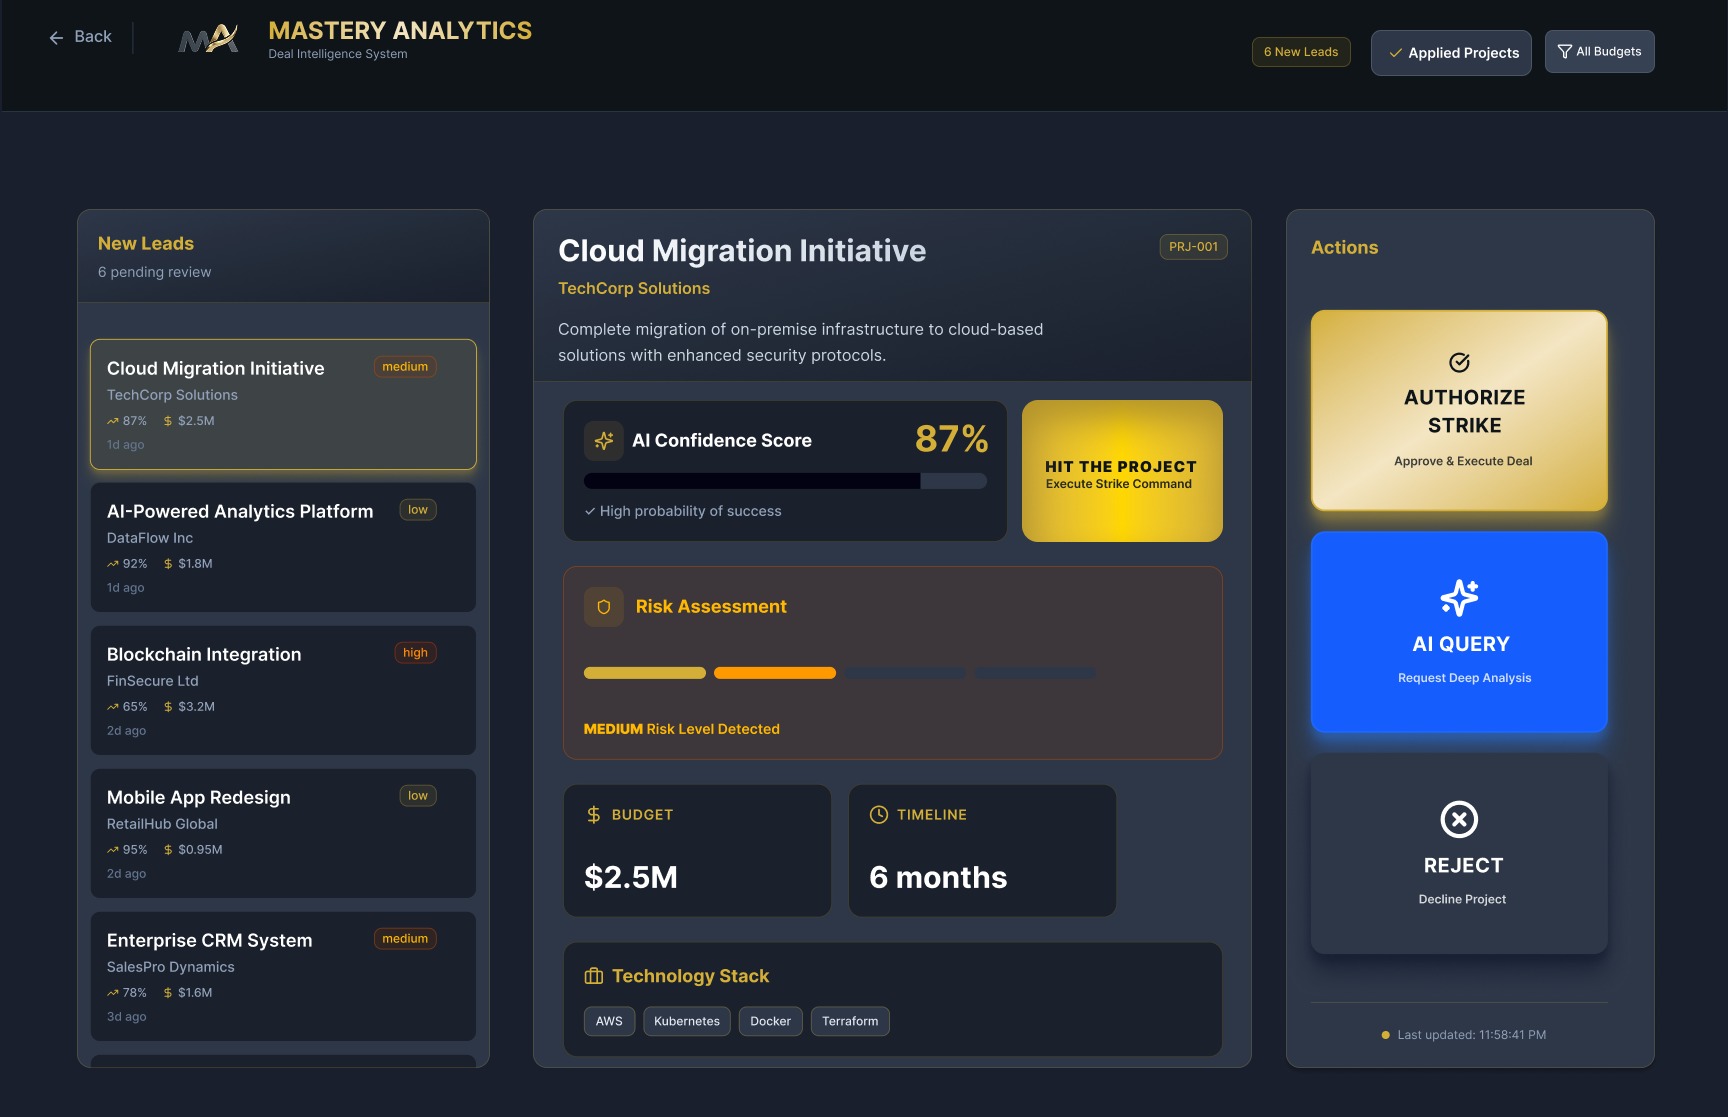
Triage dashboard: new leads list on the left, Cloud Migration Initiative detail in the middle, and Authorize Strike, AI Query and Reject on the right
1
2
3
4
5
6
7
8
9
10
11
LEAD LIST
1The selected lead glows gold, so it’s always clear which deal is open.
2Each card packs title, client, AI score, budget, age and a risk badge.
LEAD DETAIL
3The AI confidence score leads, as a number and a bar.
4Hit the Project puts a fast lane to authorize right beside the score.
5Risk is a four-step meter with the level spelled out underneath.
6Budget, timeline and tech stack answer “can we deliver it?”
ACTIONS
7Authorize Strike is the gold primary action: approve and execute.
8AI Query asks for a deeper analysis when the score isn’t enough.
9Reject is deliberately quieter, in slate.
10A live timestamp shows how fresh the data is.
HEADER
11The new-lead count, Applied Projects and the budget filter stay in reach on every screen.
09 — STATES AND FEEDBACK

Every card and button answers back when you point at it.
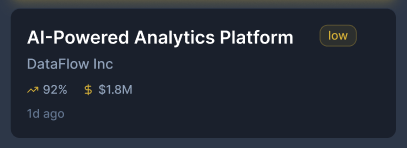
LEAD CARDSHover adds a gold outline; selection adds a warm fill and a glow.
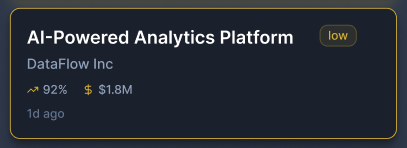
Lead card at rest: AI-Powered Analytics Platform, DataFlow Inc, 92%, $1.8M, low riskRest
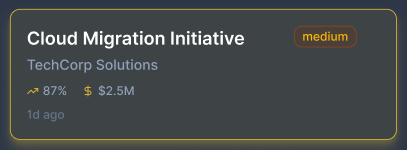
Lead card on hover with a gold outlineHover
Selected lead card with a gold outline, warm fill and glowSelected
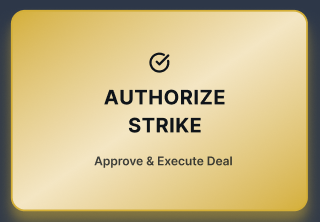
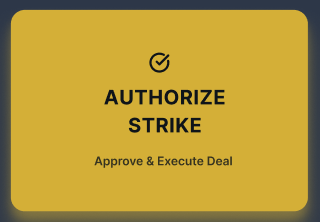
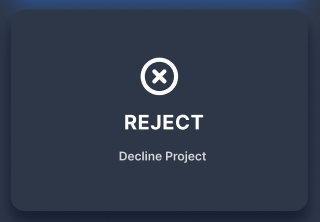
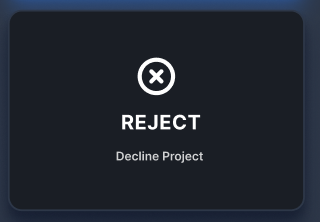
ACTION TILESOn hover, Authorize turns solid gold, AI Query deepens to navy and Reject darkens.
Authorize Strike tile at rest with a light gold gradientRest
Authorize Strike tile on hover in solid goldHover
AI Query tile at rest in bright blueRest
AI Query tile on hover in deep navy blueHover
Reject tile at rest in slateRest
Reject tile on hover in near-blackHover
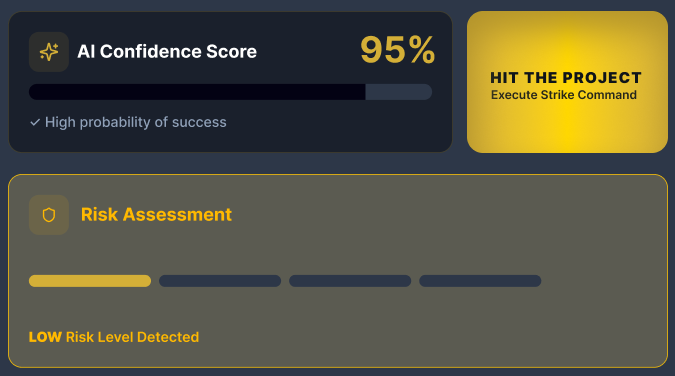
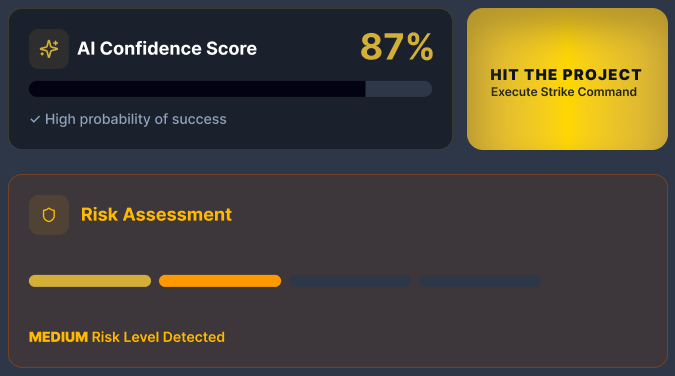
RISK AT A GLANCEThe meter fills one step per level, and its panel warms as risk rises.
Mobile App Redesign: 95% AI confidence and a low risk levelLow · Mobile App Redesign, 95%
Cloud Migration Initiative: 87% AI confidence and a medium risk levelMedium · Cloud Migration, 87%
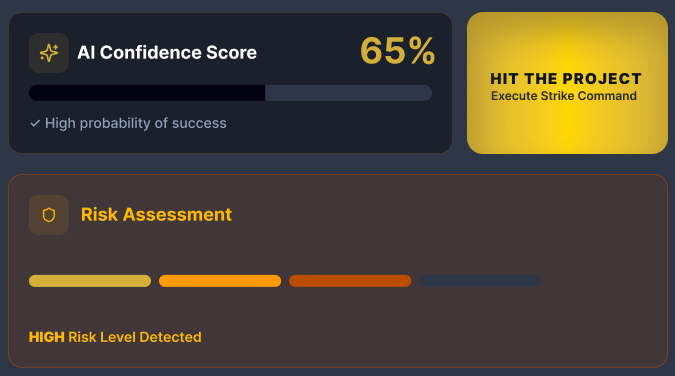
Blockchain Integration: 65% AI confidence and a high risk levelHigh · Blockchain Integration, 65%
10 — BUDGET FILTER

Narrow six leads to the three that fit, in two clicks.
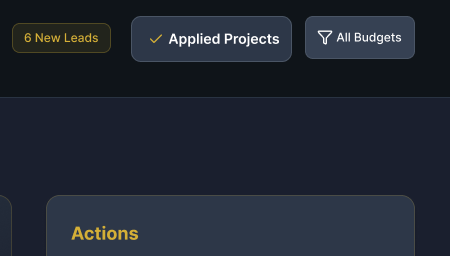
01Closed
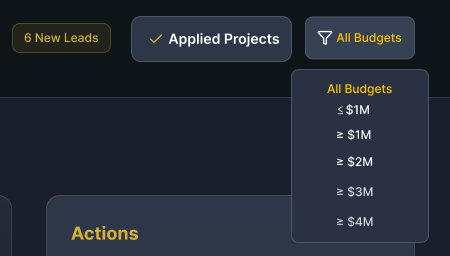
Header with 6 New Leads, Applied Projects and an All Budgets button
02Open
Budget dropdown open with All Budgets and five bands from up to $1M to $4M and above
03Hover
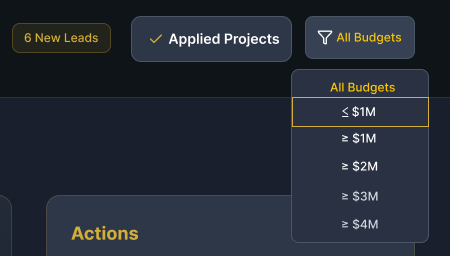
Dropdown with the up to $1M band outlined in gold on hover
04Applied
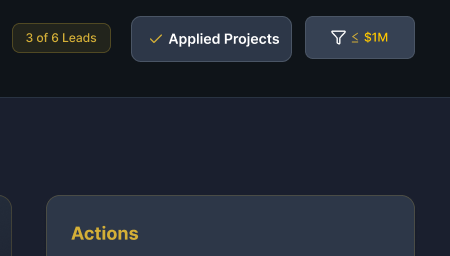
Header after filtering: the chip reads 3 of 6 Leads and the button shows up to $1M
Triage dashboard after the up to $1M filter, with three leads in the list
THE RESULT

One dropdown, five budget bands. The hovered band gets a gold outline, and the chosen one replaces “All Budgets” on the button.

The header chip changes to “3 of 6 Leads” and the list keeps only deals under $1M, so Meera can clear the smaller deals first.

The same filter works across bands, from ≥ $1M to ≥ $4M, for when she’s hunting for big deals instead.

11 — SUCCESS AND TRACKING

A win should feel like one, then go straight into the record.

Success Strike screen: a glowing gold check, 1 project successfully hit and authorized, and a Hit the Button for More Projects button
AFTER AUTHORIZE STRIKE
Success Strike!

Authorizing a deal ends in a small celebration: a glowing gold check, scattered stars and a clear count of projects won.

Success rate and AI confidence sit either side of one gold button that sends you back for more projects.

THE RECORD
Applied Projects

Every authorized deal lands here, with total applied, combined value and success rate across the top.

Each project keeps its AI confidence, timeline, applied date and ID, ready for the Monday report.
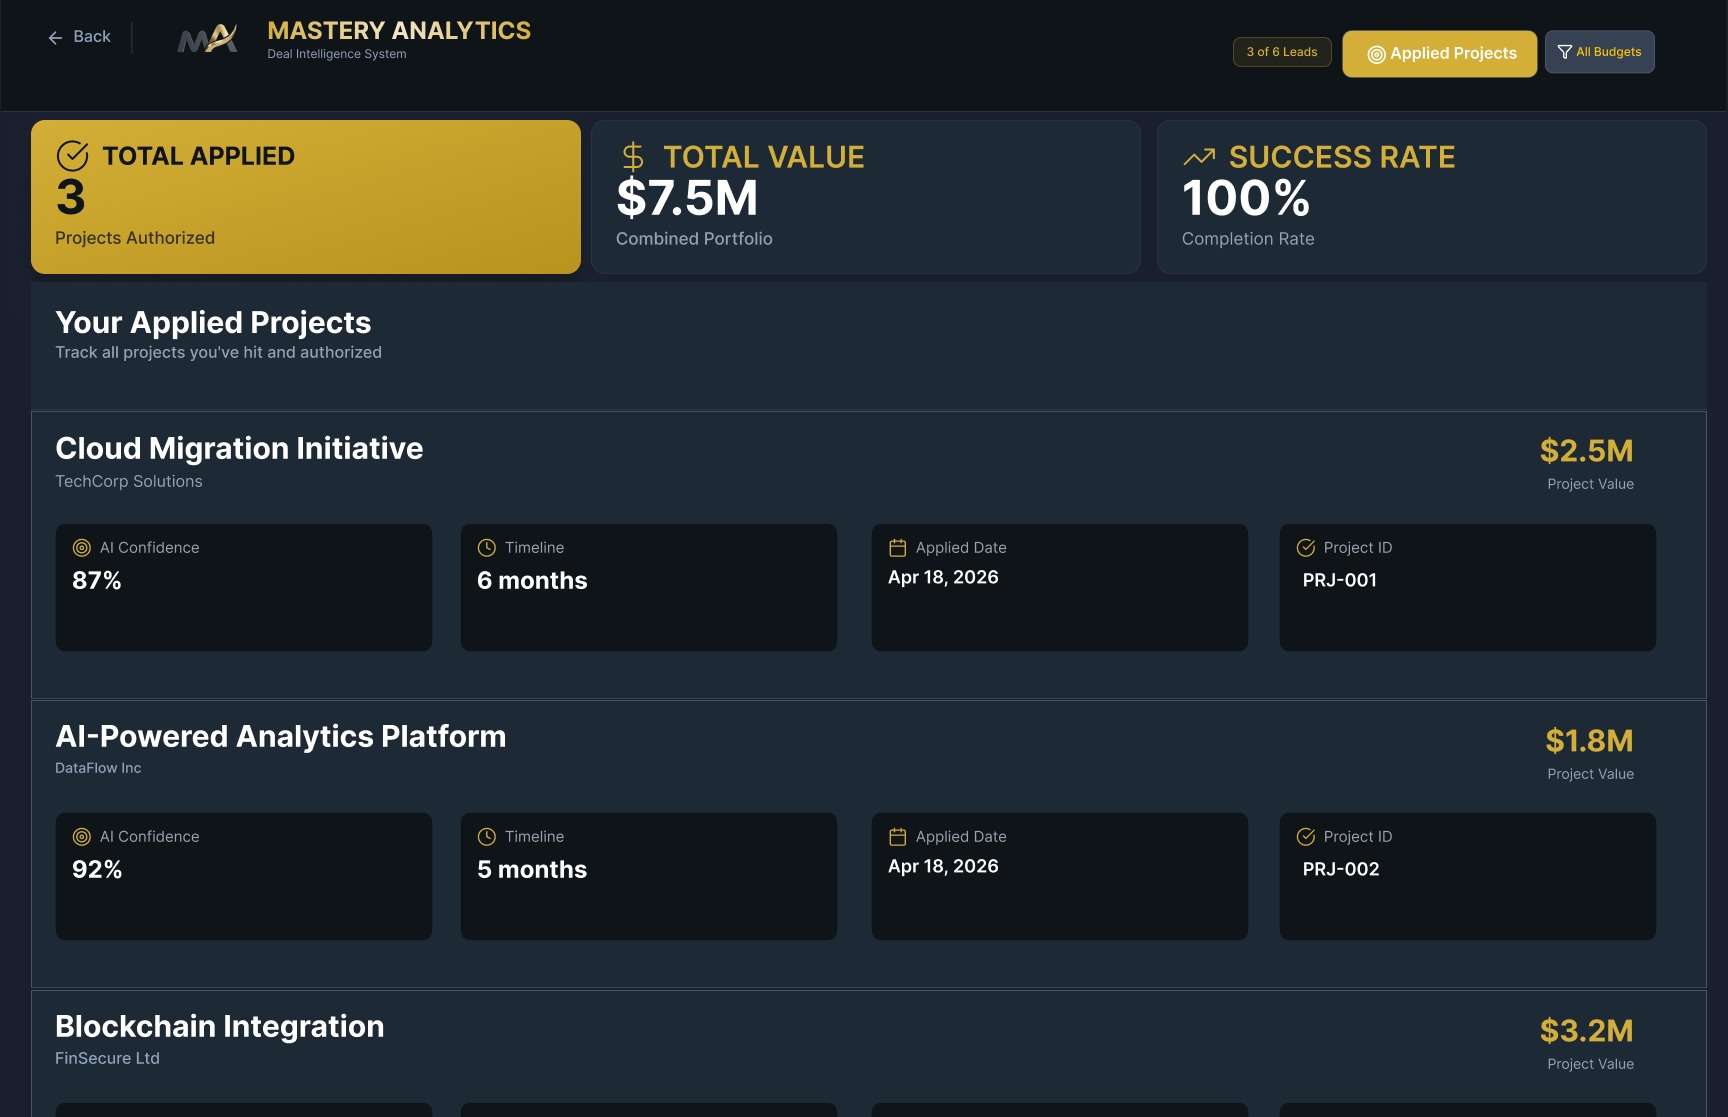
Applied Projects screen with total applied 3, total value $7.5M, success rate 100% and a list of authorized projects
12 — WHAT I’D IMPROVE NEXT

A first version is a hypothesis. Here’s what I’d change and test next.

01
Keep the detail panel in step with the filter.

After filtering to deals under $1M, the list updates but the detail panel still shows a $2.5M lead that’s no longer in it. The first matching lead should open instead.

BEFORE · FILTER ≤ $1M

List: 3 deals under $1M · Detail: Cloud Migration Initiative, $2.5M

AFTER

List: 3 deals under $1M · Detail: Mobile App Redesign, $0.95M

02
Count results, not filters

The list header reads “3 Filters” when it means 3 results, and the filtered leads aren’t among the six shown before. Keep labels and data consistent.

03
Let the AI score explain itself

A 65% lead with high risk still says “High probability of success”. Tie the caption to the score and show the top reasons behind it.

04
Confirm before committing

Authorize and Hit the Project can tie a team up for months. Add a short confirmation with the deal summary, and an undo.

05
Use budget bands that don’t overlap

“≤ $1M” and “≥ $1M” both include exactly $1M. Ranges like Under $1M, $1–2M, $2–3M and $3M+ are clearer.

06
Give long titles room

“Data Warehouse Modernization” runs into its risk badge. Wrap long titles or trim them with an ellipsis and a tooltip.

07
Test it with pre-sales teams

Time how long a decision takes, and check whether the “strike” and “victory” language fits how they talk about deals.

Mastery Analytics logo
Thank you.
Designed by Krithik Ram R K · UI/UX Designer
[Portfolio link] [LinkedIn] [Email]